America's School Staffing Retirement Cliff: Which States Face the Greatest Educator Replacement Pressure?
By: BlazerWorksSchool staffing shortages often make headlines when a new academic year begins, a district struggles to fill an opening, or an essential student service is interrupted. But another challenge is developing beyond the next hiring cycle: How prepared are schools to replace experienced educators as they leave the workforce?
Schools need more than enough staff to fill today’s vacancies. They also need a sustainable supply of qualified teachers and specialists, the ability to transfer institutional knowledge, and workforce strategies that can respond when hard-to-fill positions open unexpectedly.
To investigate, BlazerWorks developed America’s School Staffing Retirement Cliff, a 50-state School Workforce Replacement Pressure Index. Using seven indicators spanning historical teacher age profiles, educator preparation pipelines, certification, and existing staffing levels, the research identifies which states face the greatest relative workforce replacement challenges.
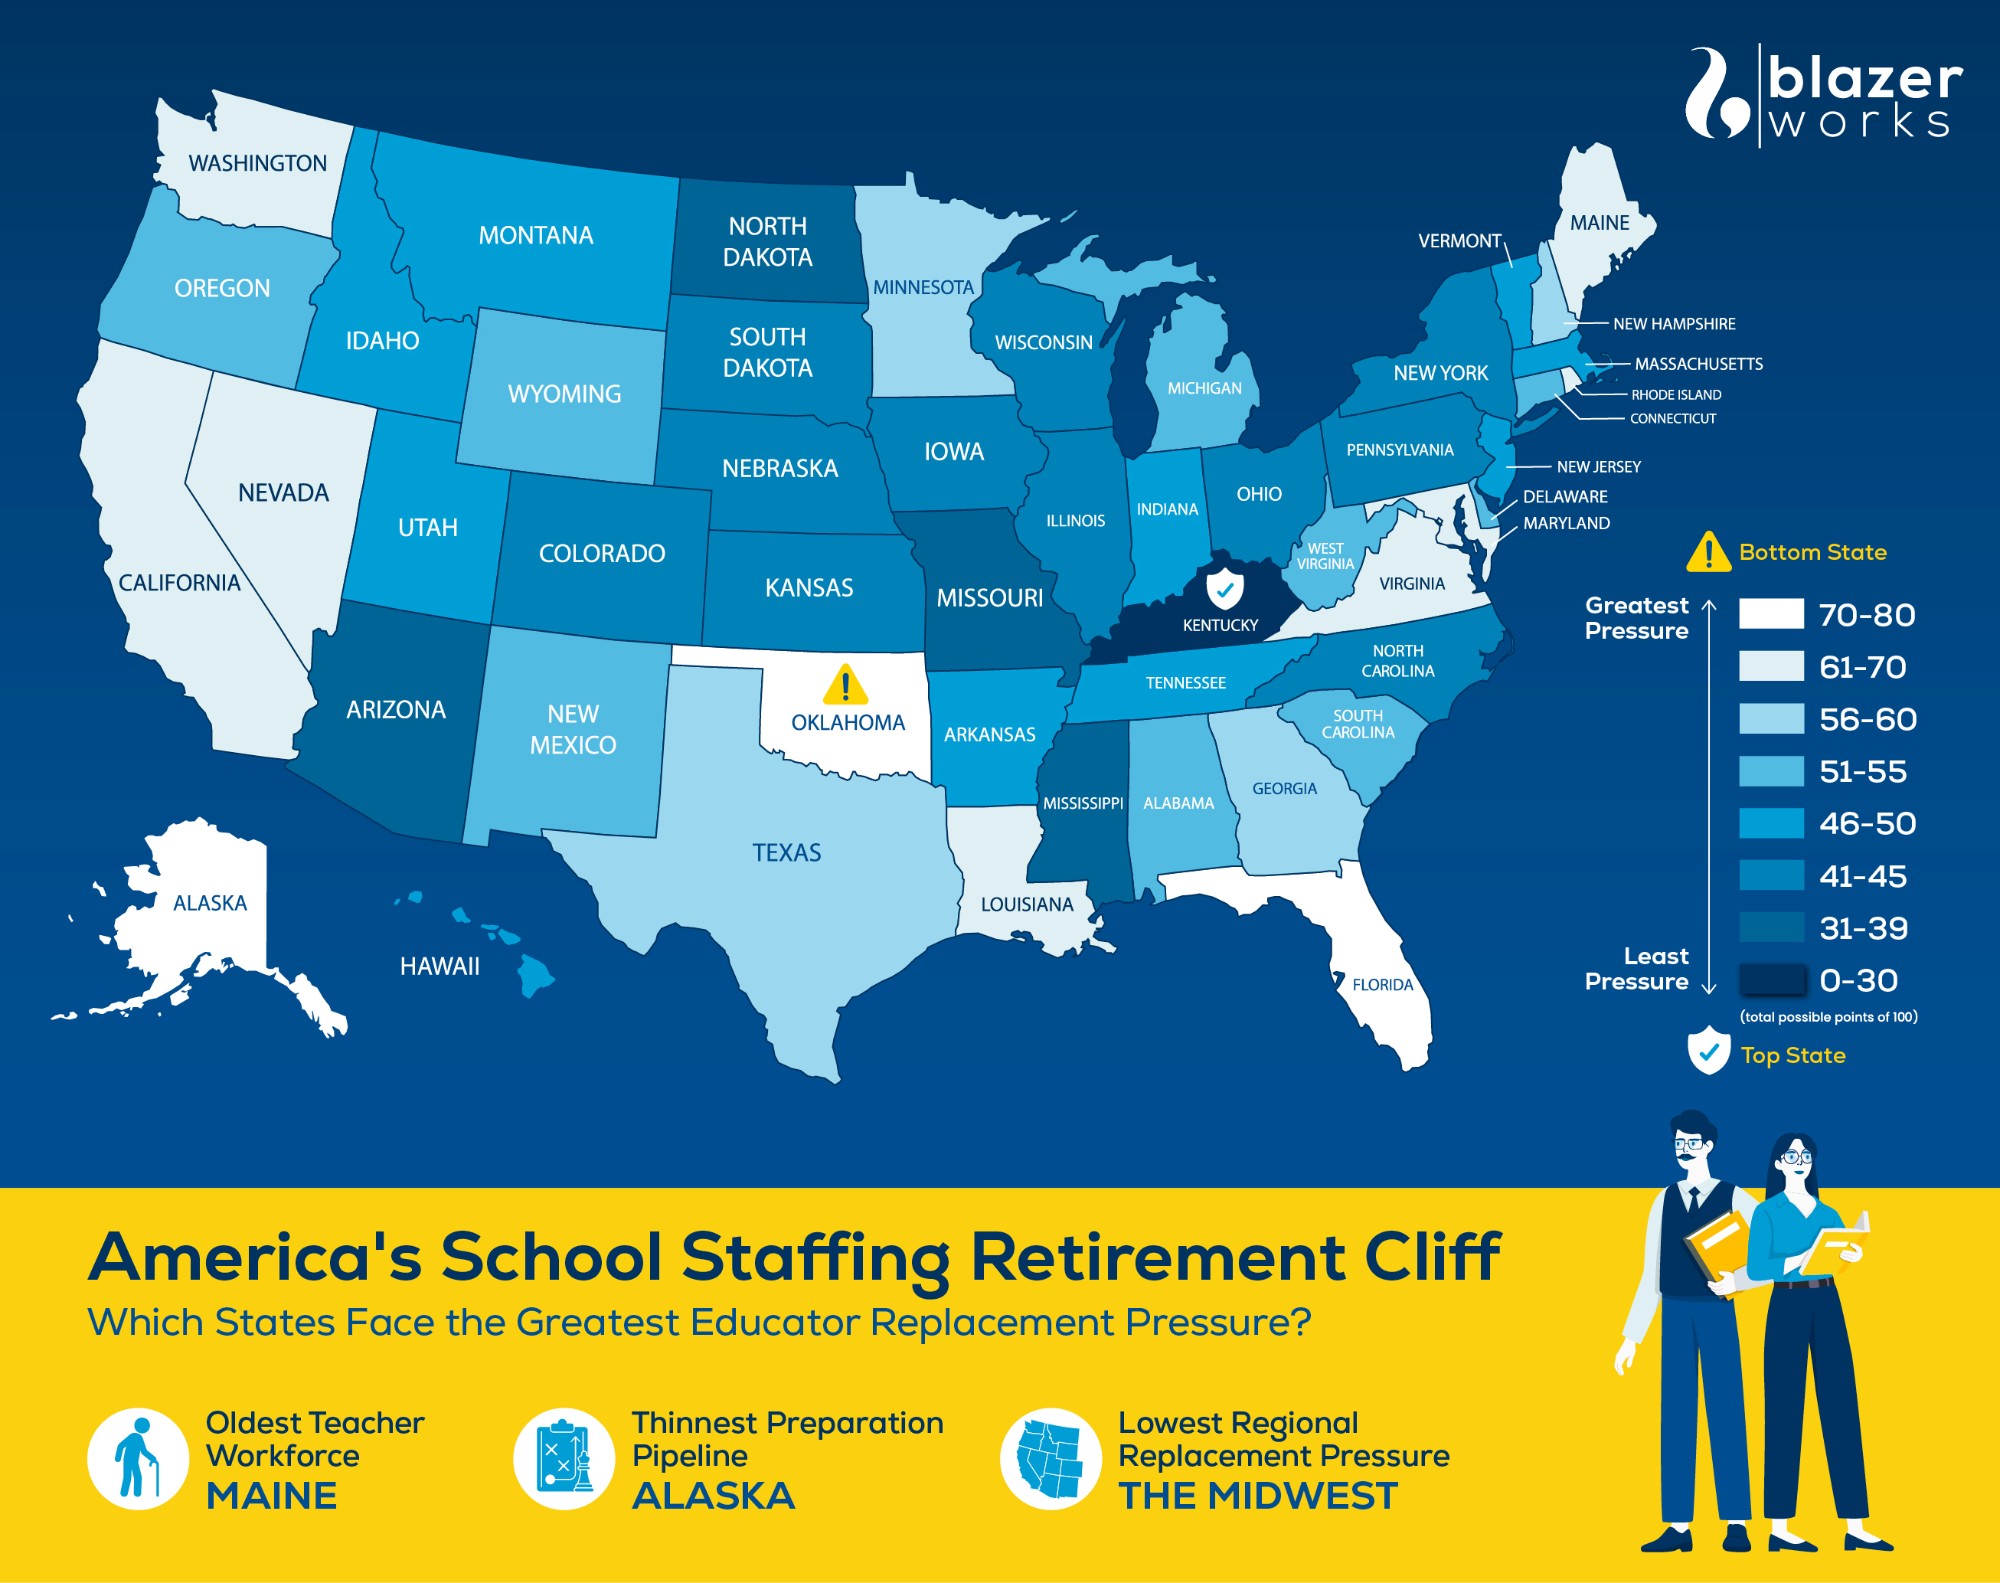
Oklahoma ranks first among the states facing the greatest school workforce replacement pressure, followed by Alaska, Florida, Nevada, and Virginia.
The results highlight how these workforce challenges vary across states, with some facing greater replacement pressure due to relatively limited teacher preparation pipelines, while others contend with more significant existing staffing shortages. In many cases, these challenges overlap, potentially compounding the impact of future educator departures.
Key Findings from the 2026 Index
- Oklahoma ranks No. 1 nationally, with a replacement-pressure score of 78.5 out of 100, followed by Alaska (76.7) and Florida (71.8).
- Maine had the oldest teacher workforce in the age dataset. In 2020–21, 29.5% of its public school teachers were aged 55 or older, compared with 17.2% nationally. Maine ranks 10th overall after other staffing measures are considered.
- Alaska had one of the thinnest in-state teacher preparation pipelines relative to its workforce. Its preparation programs reported 100 completers in 2023–24, equivalent to 1.46 completers per 100 full-time-equivalent (FTE) teachers in 2024–25.
- Kentucky ranks 50th, indicating the lowest relative pressure under this model. Its historical share of teachers aged 55 or older was 10.2%, and it recorded 7.45 teacher preparation completers per 100 teacher FTE.
- The Midwest appears better positioned to manage future educator departures. No Midwestern state ranked among the ten facing the greatest replacement pressure, and Minnesota (No. 13) was the region’s only representative in the top 20. The Midwest also recorded the lowest average replacement-pressure score of any region, at 44.3, with four of its states ranking among the ten facing the least pressure.
Which States Face the Greatest School Workforce Replacement Pressure?
The states below rank highest when retirement exposure, the pipeline of incoming teachers, and existing workforce pressure are considered together. A higher score signals greater relative pressure within this index.
| Rank | State | Index score | Teachers aged 55+ | Preparation completers per 100 teachers |
|---|---|---|---|---|
| 1 | Oklahoma | 78.5 | 26.6% | 2.57 |
| 2 | Alaska | 76.7 | 21.2% | 1.46 |
| 3 | Florida | 71.8 | 24.1% | 2.42 |
| 4 | Nevada | 69.7 | 19.7% | 4.73 |
| 5 | Virginia | 64.5 | 21.3% | 2.91 |
| 6 | Louisiana | 64.3 | 14.8% | 3.88 |
| 7 | Washington | 62.9 | 19.5% | 4.62 |
| 8 | California | 62.1 | 21.0% | 4.76 |
| 9 | Maryland | 62.0 | 17.3% | 2.40 |
| 10 | Maine | 61.5 | 29.5% | 2.84 |
Source: BlazerWorks School Workforce Replacement Pressure Index, 2026. See the methodology for all seven indicators.
1. Oklahoma: An older workforce and a constrained replacement pipeline
Oklahoma leads the index with a score of 78.5 out of 100, reflecting a combination of an aging teaching workforce, a limited educator preparation pipeline, and significant existing staffing pressures.
- An aging teaching workforce: In 2020–21, 26.6% of Oklahoma’s public school teachers were aged 55 or older, the second-highest proportion nationally. Another 12.9% were aged 50–54, meaning nearly four in ten teachers (39.5%) were at least 50 years old at the time of the survey.
- A limited pipeline of new educators: Oklahoma reported just 1,106 teacher preparation program completers in 2023–24, equivalent to 2.57 per 100 employed teachers, the fourth-lowest rate nationally. Another 4,531 candidates were enrolled in preparation programs, equivalent to 10.52 per 100 teachers, also among the lowest rates in the country.
- Significant existing staffing pressures: The Learning Policy Institute’s 2026 research identified 11,163 teachers without full certification for their assignments, equivalent to approximately 25.9 per 100 teacher FTE. The state also recorded 2.81 school counselor FTE per 1,000 students and a student–teacher ratio of approximately 16.2 to 1.
Together, these findings suggest Oklahoma could face particularly significant workforce replacement challenges if experienced educator departures continue to outpace the supply of incoming qualified professionals.
2. Alaska: A particularly small in-state training pipeline
Alaska ranks second nationally, with a replacement-pressure score of 76.7 out of 100, driven by an older teaching workforce, limited teacher preparation capacity, and existing staffing shortages.
- An aging educator workforce: In the 2020–21 survey, 21.2% of Alaska’s public school teachers were aged 55 or older, while another 14.8% were aged 50–54. Combined, 36% of teachers were at least 50 years old at the time.
- The nation’s smallest relative teacher preparation pipeline: Alaska’s educator preparation programs reported just 100 completers in 2023–24, compared with approximately 6,858 employed public school teacher FTE in 2024–25. That translates to 1.46 completers per 100 teachers, the lowest rate of any state. Another 650 candidates were enrolled in preparation programs, equivalent to just 9.48 per 100 teachers, the fourth-lowest rate nationally.
- Existing staffing shortages and limited staffing coverage: The Learning Policy Institute identified 1,603 teachers working without full certification for their assignments, equivalent to approximately 23.4 per 100 teacher FTE. Alaska also recorded 2.41 school counselor FTE per 1,000 students, while its student–teacher ratio of 18.9 to 1 was the fourth-highest nationally.
With a relatively small in-state preparation pipeline and substantial existing staffing pressures, Alaska’s findings highlight the importance of both developing local talent and maintaining access to qualified educators recruited from outside the state.
3. Florida: An aging teaching workforce alongside continuing staffing demand
Florida ranks third nationally, with a replacement-pressure score of 71.8 out of 100, as an aging teaching workforce combines with a comparatively limited pipeline of newly prepared educators.
- One of the nation’s oldest teaching workforces: In the 2020–21 age survey, 24.1% of Florida’s public school teachers were aged 55 or older, the sixth-highest proportion nationally. Another 12.6% were aged 50–54, meaning more than one-third (36.7%) of the teaching workforce was at least 50 years old at the time.
- Low teacher preparation completion and enrollment rates: Florida reported 3,777 teacher preparation program completers in 2023–24, equivalent to just 2.42 per 100 employed teachers, the third-lowest rate nationally. Another 16,280 candidates were enrolled in preparation programs, equivalent to 10.44 per 100 teachers, the sixth-lowest rate.
- Substantial existing staffing demands: The Learning Policy Institute’s 2026 research identified 25,292 teachers without full certification for their assignments, equivalent to approximately 16.2 per 100 teacher FTE. Florida also recorded 2.35 school counselor FTE per 1,000 students, among the lowest staffing rates nationally, and a relatively high student–teacher ratio of 18.3 to 1.
Its findings suggest that even a gradual increase in experienced educator departures could create substantial recruitment demands for districts already working to fill specialized and general classroom positions.
4. Nevada: Existing staffing shortages compound future replacement challenges
Nevada ranks fourth nationally, with an index score of 69.7 out of 100. Despite having a smaller proportion of older teachers than several other high-ranking states, its existing staffing indicators present significant challenges.
- Retirement exposure among existing educators: In 2020–21, 19.7% of Nevada’s public school teachers were aged 55 or older, while another 13.9% were aged 50–54, bringing the combined proportion of teachers aged 50 and older to 33.6%.
- A comparatively stronger teacher preparation pipeline: Nevada’s programs reported 1,157 completers in 2023–24, equivalent to 4.73 per 100 employed teachers, slightly above the 50-state median of 4.60. Another 5,747 candidates were enrolled in preparation programs, equivalent to 23.49 per 100 teachers.
- Some of the nation’s greatest existing staffing pressures: The Learning Policy Institute’s 2026 research identified 7,956 teachers without full certification for their assignments, equivalent to approximately 32.5 per 100 teacher FTE, one of the highest ratios nationally. The state also recorded just 2.29 school counselor FTE per 1,000 students, the seventh-lowest rate among states with available data. Meanwhile, Nevada’s student–teacher ratio of approximately 19.5 to 1 was the third-highest nationally.
Nevada’s existing certification-related staffing pressures and comparatively limited staffing coverage could make future workforce transitions especially challenging.
5. Virginia: Retirement exposure meets a limited teacher preparation pipeline
Virginia rounds out the five states facing the greatest replacement pressure, with an overall index score of 64.5 out of 100, reflecting an aging teacher workforce, relatively low preparation program participation, and existing certification-related staffing challenges.
- An aging teaching workforce: In 2020–21, 21.3% of Virginia’s public school teachers were aged 55 or older, while another 12.7% were aged 50–54. Combined, 34% of teachers were at least 50 years old at the time of the survey.
- One of the nation’s smallest relative educator preparation pipelines: Virginia reported 2,744 preparation program completers in 2023–24, equivalent to 2.91 per 100 employed teachers, the seventh-lowest rate nationally. Another 8,856 candidates were enrolled in preparation programs, equivalent to just 9.39 per 100 teachers, the third-lowest rate of any state.
- Mixed existing staffing indicators: The Learning Policy Institute’s 2026 research identified 19,215 teachers without full certification for their assignments, equivalent to approximately 20.4 per 100 teacher FTE. However, Virginia performed more favorably on other staffing measures, recording 3.59 school counselor FTE per 1,000 students, above the 50-state median, alongside a comparatively low student–teacher ratio of approximately 13.3 to 1.
Virginia’s findings suggest that an aging workforce and limited incoming teacher pipeline can create substantial long-term replacement pressure.
Which States Are Best Positioned to Replace Retiring Educators?
While some states face mounting pressure from aging teacher workforces and limited recruitment pipelines, others appear better positioned to manage future staffing transitions. Kentucky, North Dakota, Arizona, Mississippi, and Missouri rank as the five states with the lowest overall workforce replacement pressure, according to the BlazerWorks index.
1. Kentucky: A younger teaching workforce and strong pipeline of future educators
Kentucky ranks as the state with the lowest overall workforce replacement pressure, earning an index score of 27.6 out of 100. Its position reflects a combination of a relatively young teaching workforce, a strong educator preparation pipeline, and comparatively favorable existing staffing indicators.
- The nation’s youngest teaching workforce: In 2020–21, just 10.2% of Kentucky’s public school teachers were aged 55 or older, the lowest proportion nationally, compared with 17.2% across the country. Another 10.5% were aged 50–54, meaning approximately one in five teachers (20.7%) were at least 50 years old at the time of the survey.
- One of the strongest educator preparation pipelines: Kentucky reported 3,185 teacher preparation program completers in 2023–24, equivalent to 7.45 per 100 employed teachers, the third-highest rate nationally. Another 8,938 candidates were enrolled in preparation programs, equivalent to 20.9 per 100 teachers.
- Comparatively favorable existing staffing indicators: The Learning Policy Institute’s 2026 research identified 1,435 teachers without full certification for their assignments, equivalent to approximately 3.4 per 100 teacher FTE. Kentucky also recorded 3.11 school counselor FTE per 1,000 students and a student–teacher ratio of approximately 15.4 to 1.
Together, these indicators suggest Kentucky’s relatively young teaching workforce and substantial incoming talent pipeline could provide an advantage in managing future educator departures.
2. North Dakota: Strong staffing coverage and fewer educators approaching retirement
North Dakota ranks 49th nationally, with a replacement-pressure score of 32.5 out of 100. Its position is supported by comparatively favorable staffing indicators, a strong educator preparation pipeline, and a smaller share of teachers in the age group immediately preceding traditional retirement ages.
- Relatively low retirement exposure: In 2020–21, 17.2% of North Dakota’s public school teachers were aged 55 or older, while just 6.6% were aged 50–54, the lowest percentage of any state. Combined, 23.8% of teachers were at least 50 years old at the time of the survey.
- A strong pipeline of future educators: North Dakota reported 629 teacher preparation program completers in 2023–24, equivalent to 6.04 per 100 employed teachers. Another 1,961 candidates were enrolled in preparation programs, equivalent to 18.84 per 100 teachers.
- Some of the nation’s strongest existing staffing indicators: The Learning Policy Institute’s 2026 research identified just 78 teachers without full certification for their assignments, equivalent to approximately 0.75 per 100 teacher FTE, the lowest ratio nationally. North Dakota also recorded 3.55 school counselor FTE per 1,000 students and a student–teacher ratio of approximately 11.5 to 1, among the lowest in the country.
These findings suggest North Dakota may be comparatively well positioned to manage experienced educator departures, supported by a relatively strong preparation pipeline and low existing certification-related staffing pressure.
3. Arizona: A substantial teacher preparation pipeline offsets existing staffing pressures
Arizona ranks 48th nationally, with a replacement-pressure score of 35.6 out of 100. Unlike several other states with relatively low index scores, Arizona’s position is driven primarily by the exceptional size of its reported educator preparation pipeline, despite substantial existing staffing challenges.
- Moderate retirement exposure: In 2020–21, 17.4% of Arizona’s public school teachers were aged 55 or older, while another 12.9% were aged 50–54. Combined, approximately 30.3% of the state’s teaching workforce was at least 50 years old at the time of the survey.
- The nation’s largest relative educator preparation pipeline: Arizona reported 6,157 teacher preparation program completers in 2023–24, equivalent to 9.95 per 100 employed teachers, the highest rate nationally. Another 40,078 candidates were enrolled in preparation programs, equivalent to 64.79 per 100 teachers, also the highest rate of any state and substantially above other states in the index.
- Significant existing staffing pressures: The Learning Policy Institute’s 2026 research identified 8,181 teachers without full certification for their assignments, equivalent to approximately 13.2 per 100 teacher FTE. Arizona also recorded just 1.76 school counselor FTE per 1,000 students, the lowest staffing rate in the index, alongside a relatively high student–teacher ratio of approximately 17.8 to 1.
Arizona’s findings highlight the importance of translating educator preparation enrollment and completion into qualified professionals entering and remaining in classrooms. While its substantial reported pipeline contributes to a favorable overall ranking, existing certification-related staffing pressures and limited school counselor coverage remain important challenges for districts.
4. Mississippi: A younger workforce provides an advantage in succession planning
Mississippi ranks 47th nationally, with an overall replacement-pressure score of 35.8 out of 100. Its position is supported by one of the younger teaching workforces in the country and a relatively strong rate of teacher preparation program completion.
- One of the nation’s youngest teaching workforces: In 2020–21, just 12.5% of Mississippi’s public school teachers were aged 55 or older, the fourth-lowest percentage nationally. Another 9.8% were aged 50–54, meaning approximately 22.3% of the teaching workforce was at least 50 years old at the time of the survey.
- A relatively strong educator preparation pipeline: Mississippi reported 1,981 teacher preparation program completers in 2023–24, equivalent to 6.18 per 100 employed teachers, compared with a 50-state median of approximately 4.60. Another 5,055 candidates were enrolled in preparation programs, equivalent to 15.78 per 100 teachers.
- Mixed existing staffing indicators: The Learning Policy Institute’s 2026 research identified 2,095 teachers without full certification for their assignments, equivalent to approximately 6.5 per 100 teacher FTE. Mississippi also recorded 2.73 school counselor FTE per 1,000 students and a student–teacher ratio of approximately 13.5 to 1.
Although Mississippi continues to face recruitment and certification challenges, its comparatively younger teaching workforce and relatively strong teacher preparation completion rate help reduce its overall replacement-pressure score.
5. Missouri: Lower certification-related pressure strengthens workforce stability
Missouri rounds out the five states with the lowest replacement-pressure scores, ranking 46th nationally with an index score of 36.4 out of 100. Its position reflects a relatively young teaching workforce, a steady educator preparation pipeline, and comparatively favorable existing staffing coverage.
- A relatively young teaching workforce: In 2020–21, 13.0% of Missouri’s public school teachers were aged 55 or older, while another 12.4% were aged 50–54. Combined, approximately one-quarter (25.4%) of the state’s teaching workforce was at least 50 years old at the time of the survey.
- A steady pipeline of future educators: Missouri reported 3,493 teacher preparation program completers in 2023–24, equivalent to 4.96 per 100 employed teachers. Another 13,442 candidates were enrolled in preparation programs, equivalent to 19.09 per 100 teachers.
- Some of the nation’s lowest certification-related staffing pressures: The Learning Policy Institute’s 2026 research identified 1,481 teachers without full certification for their assignments, equivalent to approximately 2.1 per 100 teacher FTE, the fourth-lowest ratio nationally. Missouri also recorded 3.42 school counselor FTE per 1,000 students, above the 50-state median of approximately 2.83, alongside a comparatively low student–teacher ratio of 12.6 to 1.
Together, these indicators suggest Missouri is relatively well positioned to manage future workforce transitions, supported by lower existing certification-related staffing pressure, a younger teacher population, and a steady supply of educator preparation candidates.
Why Today’s Staffing Shortages Could Become Tomorrow’s Replacement Challenge
Teacher turnover is already placing significant pressure on districts. In a 2026 analysis, the Learning Policy Institute estimated that at least 425,412 teaching positions nationwide were either vacant or filled by teachers who were not fully certified for their assignments, equivalent to approximately one in eight teaching positions.
Retirement is only one reason educators leave. The same research identifies overall teacher attrition as a major source of annual hiring demand, meaning districts also need to address career mobility, compensation, working conditions, and retention well before employees approach retirement age.
This is why replacement planning cannot begin when an experienced teacher announces their departure. Without a clear view of future staffing needs, districts may repeatedly compete for the same limited pool of qualified applicants while losing institutional knowledge along the way.
What About Special Education Teachers and Student Support Specialists?
Long-term workforce sustainability is especially important in specialist roles, where replacing a departing professional can involve additional licensing requirements, clinical competencies, and individualized student service obligations.
Special education is already among the most widespread teacher shortage areas. According to the Learning Policy Institute, 45 states reported special education teacher shortages in 2024–25. BlazerWorks’ 2026 national survey of 500 U.S. school and district respondents also found that 90.4% reported increased demand for specialized school staff over the previous three years. Among roles cited as especially difficult to staff were special education teachers (16.4%), school psychologists (15.6%), and speech-language pathologist assistants (15.2%).
For districts, the implications reach beyond general classroom instruction:
- Special education teachers: Departures can affect IEP implementation, case management, and continuity of instruction for students with disabilities.
- School psychologists: Replacing experienced professionals can be challenging when evaluation needs, school mental health responsibilities, and state credentialing requirements converge.
- Speech-language pathologists and occupational therapists: Staffing gaps can complicate service scheduling, student evaluations, and access to related services required by individual student plans.
- Other student support roles: Counselors, behavioral specialists, and paraprofessionals may also be essential to maintaining consistent services across a district.
How School Districts Can Plan for the Staffing Cliff
Even without a precise retirement forecast, districts can use the warning signs to strengthen workforce planning today:
- Build a position-by-position succession plan: Track staff nearing retirement, anticipated departures, and hard-to-fill roles to identify where future staffing gaps could have the greatest impact.
- Develop and retain the next generation of educators: Strengthen partnerships with teacher preparation programs, offer mentorship opportunities, and invest in professional development to attract and retain qualified staff.
- Plan specialist staffing around service continuity: Anticipate future needs in special education and student support services, exploring options such as shared staffing models, teletherapy, and qualified contract professionals where appropriate.
- Streamline recruitment and credentialing: Simplify hiring processes, coordinate staffing partners, and establish clear credentialing procedures to fill vacancies more efficiently.
- Monitor workforce risks regularly: Track retirement eligibility, vacancy rates, recruitment timelines, and retention trends to identify emerging staffing challenges and adjust plans proactively.
Preparing for the Next Generation of School Staffing
A school workforce retirement cliff is not a single event on the calendar. It is a challenge that develops as experienced educators leave, newer professionals enter the workforce, and districts continue competing for people with the qualifications their students need.
The BlazerWorks index shows why school leaders should look beyond a simple count of older teachers. The greatest potential pressure emerges when experienced staff departures could coincide with limited recruitment pipelines and staffing challenges that are already difficult to resolve.
For districts planning ahead, the most practical response is to build flexible, measurable staffing plans that protect continuity of instruction and student services. Explore BlazerWorks’ education staffing solutions to see how a coordinated network of staffing partners can support recruitment, credentialing, and long-term workforce planning.
Complete Ranking: All 50 States
The following table ranks the states from greatest to lowest relative school workforce replacement pressure, based on the seven-indicator BlazerWorks model.
| Rank | State | Index Score |
|---|---|---|
| 1 | Oklahoma | 78.5 |
| 2 | Alaska | 76.7 |
| 3 | Florida | 71.8 |
| 4 | Nevada | 69.7 |
| 5 | Virginia | 64.5 |
| 6 | Louisiana | 64.3 |
| 7 | Washington | 62.9 |
| 8 | California | 62.1 |
| 9 | Maryland | 62.0 |
| 10 | Maine | 61.5 |
| 11 | Rhode Island | 61.0 |
| 12 | Texas | 59.7 |
| 13 | Minnesota | 58.9 |
| 14 | Georgia | 58.0 |
| 15 | New Hampshire | 57.1 |
| 16 | West Virginia | 54.3 |
| 17 | Oregon | 54.2 |
| 18 | Delaware | 53.4 |
| 19 | Connecticut | 53.3 |
| 20 | New Mexico | 53.0 |
| 21 | Michigan | 52.5 |
| 21 | Wyoming | 52.5 |
| 23 | Alabama | 51.9 |
| 24 | South Carolina | 51.5 |
| 25 | Hawaii | 50.7 |
| 26 | Tennessee | 50.2 |
| 27 | Montana | 49.4 |
| 28 | Utah | 49.1 |
| 29 | Arkansas | 47.5 |
| 30 | Idaho | 47.3 |
| 31 | Vermont | 47.1 |
| 32 | New Jersey | 47.0 |
| 33 | Indiana | 46.4 |
| 33 | Massachusetts | 46.4 |
| 35 | Kansas | 44.8 |
| 36 | Colorado | 44.7 |
| 37 | South Dakota | 44.2 |
| 38 | Ohio | 44.1 |
| 39 | Illinois | 43.3 |
| 40 | Iowa | 43.2 |
| 41 | Nebraska | 43.0 |
| 42 | North Carolina | 42.7 |
| 43 | Wisconsin | 42.1 |
| 44 | Pennsylvania | 41.3 |
| 45 | New York | 41.2 |
| 46 | Missouri | 36.4 |
| 47 | Mississippi | 35.8 |
| 48 | Arizona | 35.6 |
| 49 | North Dakota | 32.5 |
| 50 | Kentucky | 27.6 |
The District of Columbia is excluded because the study was designed as a 50-state comparison. States with the same published score can occupy different positions due to underlying unrounded values or shared displayed ranks.
Methodology
BlazerWorks developed the 2026 School Workforce Replacement Pressure Index to rank all 50 U.S. states based on their relative risk of future educator staffing challenges. The index combines seven indicators to capture three dimensions:
- Retirement exposure (35%): The percentage of public school teachers aged 55 and older (25%) and those aged 50–54 (10%), using teacher age data from the 2020–21 school year.
- Educator preparation pipeline (30%): The number of teacher preparation program completers (20%) and enrolled candidates (10%) in 2023–24, measured relative to each state’s existing teaching workforce in 2024–25.
- Existing staffing pressures (35%): The number of teachers without full certification for their assignments relative to the teaching workforce (20%), school counselor staffing per 1,000 students (10%), and student–teacher ratios (5%).
Data were sourced from the National Center for Education Statistics (NCES), U.S. Department of Education Title II teacher preparation reports, and the Learning Policy Institute, using the most recent available data selected for each indicator.
Each indicator was standardized to a 0–100 scale, with higher values representing greater replacement pressure. Indicators were then combined using the assigned weights to calculate each state’s overall score and ranking.
Important considerations: The index measures relative workforce replacement pressure rather than predicting the number of educators who will retire. Data reporting periods vary, and teacher preparation figures do not necessarily represent educators who will ultimately work in the state where they trained. Certification-related staffing figures also reflect state reports with varying definitions and reporting years. School counselor staffing data were unavailable for Tennessee, so its score was calculated using the remaining six indicators, with their weights proportionally adjusted to maintain a 100% total.